Introduction to R and RStudio Course - Data Visualisation with ggplot2
Available Languages:
Available Languages:
Dated: August 2023
Authors: Sam Dumble , Alex Thomson , Nicolas Greliche
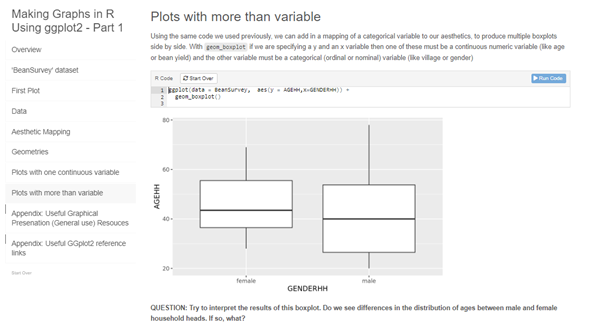
Below you can find links to all 4 workbooks associated with the data visualisation with ggplot2 module from the Introduction to R and RStudio course.This module covers how to build different types of graphs using the package ggplot2, a simple and effective way to create sleek looking data visualisations using R. We build up the code step by step to show you had to add in your variables, your chart type, colours, labels and so on until you have wonderful looking graphs ready for presentation.Part 1 - Basics of ggplot2 - Aesthetics and geometriesPart 2 - Customisation - Colours, scales and labelsBoth parts are accompanied with additional exercise workbooks
The individual components of the trove are listed below. Click on one to download the file or go to the external url. You can download the full trove below as a .zip file.
Part 2 - Exercises
https://shiny.stats4sd.org/RCourse_revamp_Data_Viz_ex2__2023/
Curricula / Training Course
Introduction to R and RStudio Course - Data Manipulation
This link provides direct access to the Data Manipulation module from the Stats4SD Introduction to R and RStud...

Curricula / Training Course
Introduction to R and RStudio Course - Statistical Analysis
This link provides direct access to the Statistical Analysis module from the Stats4SD Introduction to R and...
Curricula / Training Course
Introduction to R and RStudio Course - Working with RStudio
This link provides direct access to the Working with RStudio module from the Stats4SD Introduction to R and RS...
Curricula / Training Course
Introduction to R and RStudio Course - Data Management
This link provides direct access to the Data Management module from the Stats4SD Introduction to R and RStudio...